If Needham’s housing headlines have ever felt confusing, you are not imagining it. One report can show homes selling fast and above list, while another suggests prices are lower or inventory is higher. If you are buying or selling a single-family home in Needham, the good news is that the numbers make more sense once you know what they are actually measuring. Let’s dive in.
Why single-family data matters in Needham
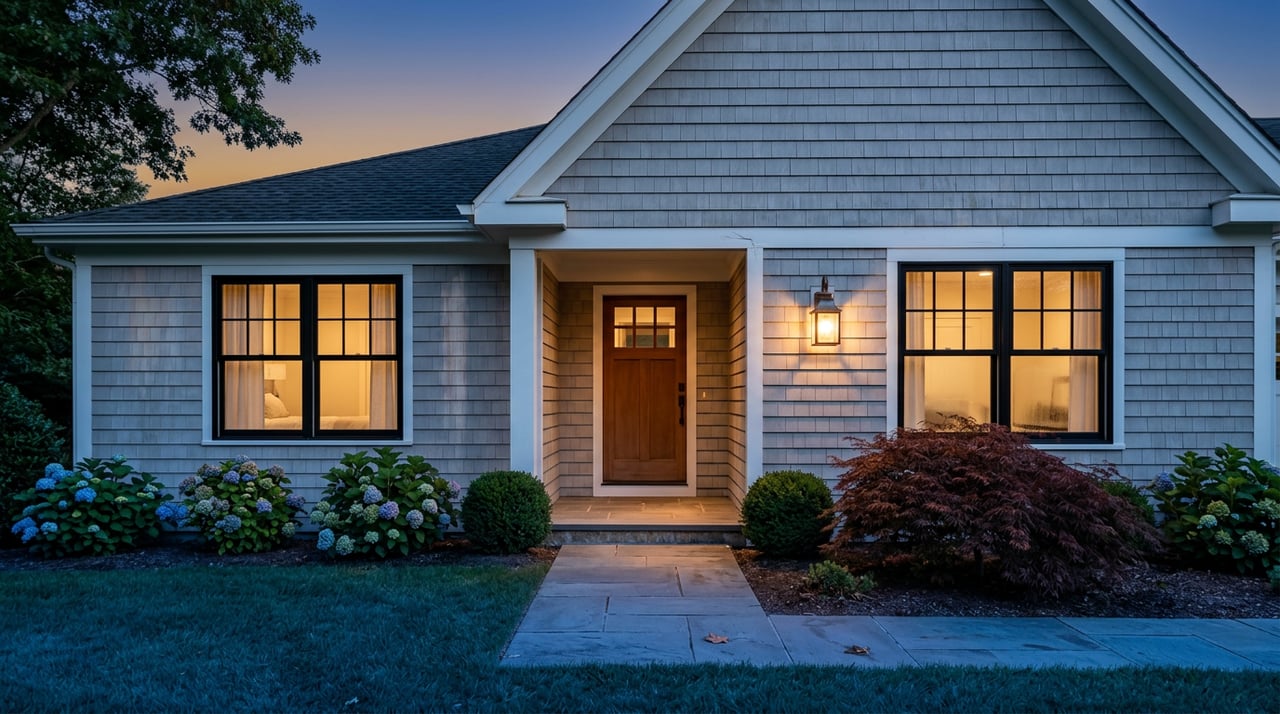
Needham is especially important to read through a single-family lens because so much of the town’s housing stock falls into that category. According to the town’s housing plan, detached and 1-unit attached homes make up about 82% of housing units, and about 94% of owner-occupied units are in single-family detached or attached homes.
That means many of the market headlines you see in Needham are being shaped by a town where single-family housing plays the dominant role. If you are shopping for a house or preparing to sell one, single-family trends are often the clearest way to understand what is happening locally.
Needham market snapshots at a glance
Several recent data sources offer useful snapshots of the Needham market, but they do not match exactly. That does not mean one is right and the others are wrong. It means they are using different timeframes, definitions, and in some cases different housing-type mixes.
Here is a quick look at the recent numbers:
| Source | Timeframe | Key Needham Metric Highlights |
|---|---|---|
| MAR/ShowingTime single-family report | March 2026 year-to-date | Median sales price: $2.419M, inventory: 40 homes, months supply: 1.9, cumulative days on market: 64, original list price received: 96.6% |
| Redfin | Updated through May 2026 | Median sale price: $1.684M, median days on market: 20, sale-to-list ratio: 100.6% |
| Zillow | Updated through May 31, 2026 | For-sale homes: 97, new listings: 47, median sale price: $1.383M for April 30, 2026, median sale-to-list ratio: 0.991 |
The main takeaway is simple: compare like with like. The MAR report is focused on MLS-based Needham single-family data, while Redfin and Zillow publish platform-specific market views with their own methods.
Why market headlines can seem contradictory
The biggest reason headlines differ is that they often answer different questions. A year-to-date local single-family report is not the same thing as a platform snapshot updated on a different schedule. Even when they describe the same town, they may be measuring a different slice of the market.
Time window matters a lot. A report covering closings through March can look very different from a platform update through May, especially in a town with a relatively small number of sales.
Sample size matters too. The March 2026 MAR report specifically notes that one month can look extreme because the number of transactions is small. In a high-price market like Needham, just a few sales can noticeably move the headline median.
How to read median sale price
Median sale price is the midpoint of closed sales, not the average. That makes it useful because a few very expensive homes are less likely to skew the number.
In Needham, though, even the median can move around when the number of sales is limited. The MAR single-family year-to-date median rose from $2.300M through February 2026 to $2.419M through March 2026. That is a meaningful shift, but it does not automatically mean every home type or price point moved the same way.
If you are a buyer, this means you should be careful about assuming one median price tells you exactly what your target home will cost. If you are a seller, it means your pricing strategy should be based on comparable homes, not just a townwide headline.
What days on market really tells you
Days on market is a pace metric. It tells you how long homes typically sit before going under contract, but it does not predict how any individual listing will perform.
Redfin’s Needham snapshot showed a median of 20 days on market through May 2026. That suggests many homes are moving fairly quickly. Still, recent examples in Needham show a wide spread: one home sold after 58 days at 13% over list, another sold after 134 days at 2% under list, and another sold after 217 days at 3% under list.
That range is a reminder that condition, pricing, and presentation still matter. A well-prepared, well-priced home can attract strong attention, while a home that feels overpriced or less turnkey may take longer.
How to understand sale-to-list ratio
Sale-to-list ratio is one of the most misunderstood metrics in real estate. In simple terms, 99% means a home sold for 1% below list, and 101% means it sold for 1% above list.
That is why two statements can be true at the same time in Needham. Redfin reported a 100.6% sale-to-list ratio, while the March 2026 MAR single-family report showed 96.6% of original list price received year-to-date.
The difference is important. One figure may reflect final list price or platform-specific calculations, while the MAR number focuses on original list price received. For sellers, this is a strong reminder that pricing high and planning to negotiate down is not always the best move. For buyers, it shows that some homes still attract aggressive offers even when the broader market is not uniformly above ask.
Inventory and months supply explain competition
If you want one metric that helps explain the pressure buyers and sellers feel, look at inventory and months supply. Redfin defines months of supply as inventory divided by the current sales pace.
Many housing economists use about 4 to 6 months of supply as a balanced range. Needham’s March 2026 MAR single-family report showed just 1.9 months of supply, which is well below that benchmark.
For buyers, that usually means fewer choices and more urgency around homes that are well positioned. For sellers, it points to continued demand, but not a free pass on pricing or preparation.
Needham is really a set of submarkets
One of the most useful ways to read Needham is to stop thinking of it as one single market. It is more accurate to think of it as a group of smaller submarkets moving at different speeds.
Move-in-ready homes, renovated homes, and premium homes can still draw strong offers. At the same time, homes that are dated, less turnkey, or priced too aggressively may sit longer and sell below original asking price.
This is why broad town numbers only get you so far. If you are buying or selling, the more useful question is not just, “What is the Needham market doing?” It is, “What is happening with homes like mine or the one I want?”
What buyers should take from this data
If you are buying a single-family home in Needham, the market data points to one clear theme: preparation matters. With months supply below 2 and median days on market moving quickly in some reports, the best homes may not leave much room for delay.
That does not mean every listing becomes a bidding war. It does mean you will be in a stronger position if your financing, timing, and must-have list are clear before you start touring seriously.
It also helps to stay flexible. Since Needham behaves like a collection of submarkets, two homes with similar list prices may attract very different levels of competition based on condition, updates, and how they are priced.
What sellers should take from this data
If you are selling, the Needham numbers support a balanced message. Demand is still present, and lean inventory can work in your favor. But that does not mean every home will automatically command a premium.
The March 2026 single-family data showed 96.6% of original list price received year-to-date. That tells you initial pricing discipline still matters.
Homes that come to market well prepared and realistically priced are better positioned to capture serious buyer attention early. Homes that overshoot the market may spend longer on the market, which can weaken momentum and increase the chance of later price adjustments.
The smartest way to read Needham trends
The best strategy is to compare the same property type, the same source, and similar seasonal timing. In Needham, that means single-family to single-family, spring to spring or winter to winter, and one source to that same source over time.
That approach gives you a much cleaner read than bouncing between headlines that use different definitions. It also helps you make decisions based on the market segment you are actually in, not a townwide average that may blur important details.
If you want help translating the numbers into a plan for your next move in Needham, Elissa Rosenfelt can help you make sense of the local single-family market with clear, practical guidance.
FAQs
What does the median sale price mean for Needham single-family homes?
- It is the midpoint of closed sale prices, not the average, which makes it helpful for spotting pricing trends without letting a few very high sales distort the picture.
Why do Needham market reports show different prices and inventory counts?
- Different sources use different timeframes, definitions, and housing-type mixes, so the most accurate comparisons come from tracking the same source over time.
Is Needham a buyer’s market or seller’s market for single-family homes?
- The March 2026 MAR single-family report showed 1.9 months of supply, which is well below the commonly cited balanced range of 4 to 6 months and suggests lean inventory.
What does days on market tell you about Needham homes?
- It shows how quickly homes typically go under contract, but individual results can vary widely based on pricing, condition, and presentation.
Should Needham sellers expect to get over asking price?
- Not always. Some homes do sell above list, but the March 2026 MAR single-family report showed 96.6% of original list price received year-to-date, so pricing strategy still matters.
How should Needham buyers use market data when planning a purchase?
- Focus on single-family data, compare similar homes, and be ready early, since low supply and fast-moving listings can limit your room to wait on the best-fit homes.